Thursday, August 22, 2019

Scale is more than math


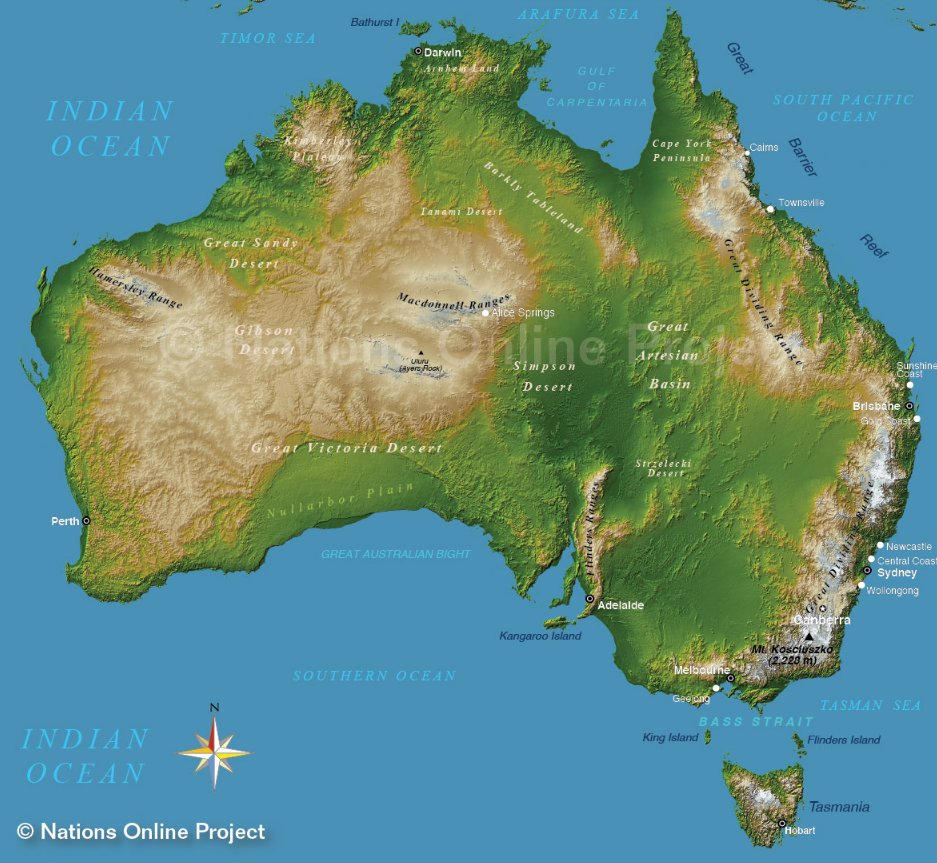
Image above: The zoom tool of spatial levels and scale.


Making sense of scale
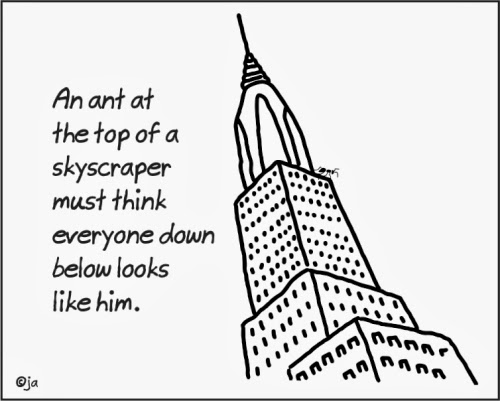
It is important that we explore the concept of scale and discussed the idea of looking at scale like a zoom tool. That is, as 21st Century citizens we zoom in and out of the spatial levels as we think about geographical events, phenomena and processes. One minute we may be thinking at the spatial level of global, then regional, then national and then local (not necessarily in that order). We repeatedly zoom in and out as we try to make sense of our world in geographical terms. This has not always been the case in the past, with citizens being much more locally focussed without access to travel, education and media that allow a broader perception of scale. It can be argued that there is a difference in scale perception between rural and city dwellers, less developed and more developed countries and between isolated and less isolated places. Certainly food for thought as we consider world views on a range of issues. 
Basically the creation of a map at a particular scale is simply a snapshot of where we are thinking at the time - if thinking global we create a map of the world at the appropriate scale.

This posting gives a few ideas on practical ways to understand the concept of scale and delves into the terms small and large scale maps.

Some hands-on ideas
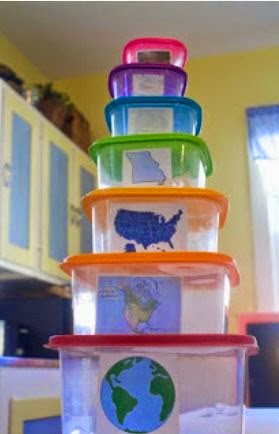
To help demystify scale some teachers have suggested the use of different size Tupperware to demonstrate how one spatial level dovetails into another. As shown in the image above, the teacher has placed cut-outs of world maps, national, regional and local inside each of the varied  size Tupperware containers.

Another interesting way some teachers employ is the use of Babushka dolls to demonstrate the spatial levels of scale.

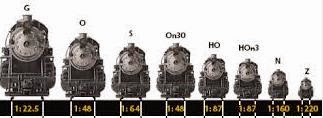
After getting across the concept of spatial levels and zooming in and out we can move onto exploring the mathematical aspect of scale. A student friendly way to engage the concept of map scale and ratio is through the study of the scale of model trains/planes/boats. The 1:real  life ratio is certainly a good way for students to relate to the concept of scale before trying to decipher a map ratio (also referred to as a Representative Fraction - RF) such as 1: 100 000.
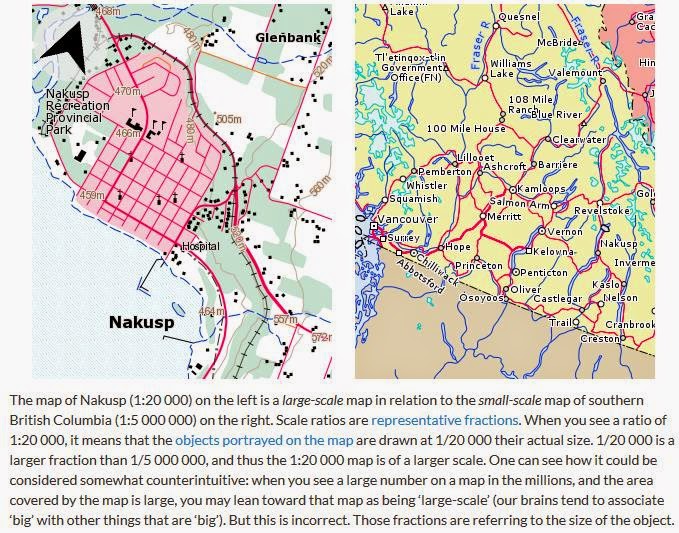


point of scale which often causes consternation is the question of what is a small scale map versus a large scale map? To help with this it is best to just say that the smallest scale map is the globe (RF of 1: 40 million) - shows a large all of the world at little detail. Every map of a lesser ratio in number is called a large scale map - shows a smaller area of the earth in greater detail i.e. a 1:100 000 map is a smaller scale map that a 1:50 000 map. Just think 'globe small, 'globe small'!! ... and then work backwards from there to the largest scale maps of the local area.


Wednesday, March 16, 2016

Mapping basics


We are all geographers, so basic mapping should be as easy as pie for us.

For students to read a map they need to:
  • understand compass directions, grid references and the map's legend and scale
  • be able to find features when given a map reference
  • be able to describe the location of a feature on a map by giving a map reference
  • identify and describe distributions, correlations and patterns (plus more)/

 Here is a really basic guide to mapping to think about and jolt those brain cells.


Basic mapping

Maps are representations of the world created by people called cartographers to help other people navigate the world. Maps contain information tailored to a specific purpose.
  • A road map, for example, contains information that helps the reader get from one place to another using a vehicle.
  • The maps found in a geographical atlas will contain information of less interest to a road user, such as how the land in a place is used, the population density and the political boundaries that exist between regions, states and nations.
There are five fundamental things you need to be familiar with to read a map successfully:
  • compass directions
  • grid references
  • map's key
  • title
  • scale
1.      Compass directions
Compass directions are vital for finding your way around a map. Starting at the top and moving clockwise the directions on a compass or map are:


 Points of a compass

2.      Grid references
Maps are divided into numbered squares. These squares can be used to give a place a four or six-figure grid reference. It is important that you know both four-figure and six-figure grid references.

Eastings

Eastings are lines that run up and down the map. They increase in number the further you move east (or right). You can use them to measure how far to travel east.

Northings

Northings are lines that run across the map horizontally. They increase in number the further you move north (or up the map). You can use them to measure how far to travel north.
Remember:
  • numbers along the bottom of the map come first and the numbers up the side of the map come second
  • the four-figure reference 2083 refers to the square to the east of Easting line 20 and north of Northing line 83
  • the six-figure reference 207834 will give you the exact point in the square 2083 - 7/10s of the way across and 4/10s of the way up

3. Legend/key
Just like a key to a door, the legend/key on a map helps you to unlock the information stored in the colours and symbols on a map. You must understand how the key relates to the map before you can unlock the information it contains. The key will help you to identify types of boundaries, roads, buildings, agriculture, industry, places of interest and geographical features.

 4.Title
The title of a map gives you a general idea about the information it stores.


5. Scale
Some basics to start
·        100cm in a metre
·        100 000cm in kilometre
·        1000 metres in a kilometre


The scale of a map allows a reader to calculate the size, height and dimensions of the features shown on the map, as well as distances between different points. The scale on a map is the ratio between real life sizes and how many times it has been shrunk to fit it on the map.

An example
With a 1:50,000 scale map, 1 cm on the map represents 50,000 cm on the ground (= 500 m or 0.5 km).

A scale can be represented as a”
a.   ratio or representative fraction (RF) indicates how many units on the earth's surface is equal to one unit on the map. It can be expressed as 1/100,000 or 1:100,000. In this example, one centimeter on the map equals 100,000 centimeters (1 kilometer) on the earth. Or even 1 paperclip on the map is equal to 100,000 paperclips on the ground.
b.   A word statement gives a written description of map distance, such as "One centimeter equals one kilometer" or "One centimeter equals ten kilometers." Obviously, the first map would show much more detail than the second because one centimeter on the first map covers a much smaller area then on the second map.
c.   A graphic scale is simply a line marked with distance on the ground which the map user can use along with a ruler to determine scale on the map.

The smaller the number on the bottom of the map scale, the more detailed the map will be. A 1:10,000 map will show objects ten times as large as a 1:100,000 map but will only show 1/10th the land area on the same sized piece of paper


 A video on scale to watch


About map projections of the world

This clip from the series 'West Wing' explores how different projections influence our perception of the world. It challenges the idea that there is one 'correct' version of the world map.

An online game where you return the "misplaced" country on the world map.  As you move the country north or south the country expands or contracts according to how that country would be projected if that were its actual location on a Mercator map.


The grid reference system for the globe


The ancient Greek geographer Ptolemy created a grid system and listed the coordinates for places throughout the known world in his book Geography. But it wasn't until the middle ages that the latitude and longitude system was developed and implemented. This system is written in degrees, using the symbol °.

Latitude

When looking at a map, latitude lines run horizontally. Latitude lines are also known as parallels since they are parallel and are an equal distant from each other. Each degree of latitude is approximately 69 miles (111 km) apart; there is a variation due to the fact that the earth is not a perfect sphere but an oblate ellipsoid (slightly egg-shaped). To remember latitude, imagine them as the horizontal rungs of a ladder ("ladder-tude"). Degrees latitude are numbered from 0° to 90° north and south. Zero degrees is the equator, the imaginary line which divides our planet into the northern and southern hemispheres. 90° north is the North Pole and 90° south is the South Pole.

Longitude

The vertical longitude lines are also known as meridians. They converge at the poles and are widest at the equator (about 69 miles or 111 km apart). Zero degrees longitude is located at Greenwich, England (0°). The degrees continue 180° east and 180° west where they meet and form the International Date Line in the Pacific Ocean. Greenwich, the site of the British Royal Greenwich Observatory, was established as the site of the prime meridian by an international conference in 1884.

How Latitude and Longitude Work Together
To precisely locate points on the earth's surface, degrees longitude and latitude have been divided into minutes (') and seconds ("). There are 60 minutes in each degree. Each minute is divided into 60 seconds. Seconds can be further divided into tenths, hundredths, or even thousandths. For example, the U.S. Capitol is located at 38°53'23"N , 77°00'27"W (38 degrees, 53 minutes, and 23 seconds north of the equator and 77 degrees, no minutes and 27 seconds west of the meridian passing through Greenwich, England).


Getting out and about with fieldwork


Images above: Students at Findon High School in Adelaide collecting data in the field - from within the school grounds to the outback - all fieldwork!


Fieldwork: The geographers lab

"Schools should place a renewed focus on traditional geography field trips to stop pupils being trapped behind computer screens in the classroom", Michael Palin has warned.
 
Fieldwork makes geography come to life, puts everything into context.


Field work is the process of observing and collecting data about people, cultures, and natural environments. Field work is conducted in “the wild” of our everyday surroundings rather than in the semi-controlled environments of a lab or classroom.


One of the hotspots during discussions as the Australian Curriculum: Geography has been developed and written has been the place of fieldwork in geography. Most geographers see fieldwork as fundamental to good geographical education and consider that it is fieldwork which makes our subject unique in the school curriculum. Whilst the discussion is not on the worth of fieldwork, the issues are about to what extent we can mandate it and make it an expectation of all who teach geography from F-12. Issues of inclusivity for all, cost, risk, ability of non-geography teachers to conduct fieldwork and the time involved (often in other class time) come into the equation as jurisdictions and schools consider the mandating of fieldwork for all year levels.
It is worth noting at this stage that one of the aims of geography stated in the January 2011 Australian Curriculum: Geography shape paper was:

To develop students’ ability to ask geographical question, plan an enquiry, collect and analyse information, (particularly through fieldwork and spatial technology) ...

However one notes that the direct mention of fieldwork was removed from the aims in the October 2011 draft scope and sequence which reads as:

.. that students develop:
the capacity to be competent, critical and creative users of geographical inquiry methods and skills

Fieldwork does appear in the Rationale though when it is stated that:

Fieldwork, the mapping and interpretation of spatial distributions, and the use of spatial technologies are fundamental geographical skills

If we are going to see fieldwork embedded in the aims and pedagogical expectations and in turn mandated, we need to review the nature of fieldwork, reasons why it is so important and provide a few examples for consideration. This posting and the next few are dedicated to these fieldwork considerations. Hopefully they provide useful background for the writers of the Australian Curriculum: Geography to mandate fieldwork in our schools, as all classroom geographers desire.

In essence, geographers regard fieldwork as a vital instrument for understanding our world through direct experience, for gathering basic data about this world, and as a fundamental method for enacting geographical education.


This YouTube called “Why is fieldwork important to geography” from our friend in the States, Joseph Kerski, President of American Geographers is a good starting point.


On the issue of the benefits of fieldwork the Royal Geographical Society in the UK says:

Fieldwork is an important part studying geography. Fieldwork offers a wonderful way of seeing the world, and a chance for personal development. Doing fieldwork can make a difference to your life and future career.

They go on to cite the benefits of fieldwork as:

Seeing geography and theories come to life
- improving your knowledge of geography and understanding
Developing your skills - givnig you a chance to learn skills such as:• data collection and analysis, map work, observational and investigative skills
• computer and technology skills
• communication and mathematical skills
Appreciating environments – giving you a chance to experience and enjoy a wide range of environments and landscapes
Opinions & views – It helps you to understand other peoples and cultures, and your own views about social, political or environmental issues
Learning, communication, confidence - you take responsibility for your learning, gaining confidence and develop skills, such as leadership, teamwork and communication
It’s fun!


At this stage, before watching the South Australian fieldwork trials which will be showcased in the next few postings, it is useful to look at the fieldwork packages and the associated pedagogies on a wide range of fieldwork from the Barcelona Field Studies Centre in Spain. Great case studies!

To support our thinking on the pedagogy of fieldwork, the types and examples from the Field Council site in the UK are also a great resource to review.

As an Australian example of fieldwork here is the GeogStandards project documentation of the work of AGTA’s friend Stephen Cranby in Victoria.


Fieldwork in the curriculum


Image above: Loxton High School students doing fieldwork on the River Murray, South Australia.

Sites related to GeogSplace  
SACE Board of SA
GeogSpace
Spatialworlds blog
Spatialworlds website
Course details on Flo
Australian Curriculum Portal
Geogaction
DECD Learning Resources for Australian Curriculum
DECD Achievement Standards Charts 
Australian Geography Teachers' Association website

Geography Teachers Association of South Australia

Scoop.it sites


Where am I??  

Adelaide, Australia: S: 34º 55' E: 138º 36'


River fieldwork to study the Year 8 draft "Landscapes" unit.

This posting showcases the DECD trial project on fieldwork at Loxton High School in South Australia during October 2011. The trial used the draft Year 8 unit on Landscapes, with a focus on the use of fieldwork involving the integration of spatial technology.

The Year 8 Landscape unit of the Australian Curriculum: Geography focuses on the nature of landscapes and the forces, processes and factors which shape them physically, as well as people’s perceptions and use of them. The unit examines, at a variety of scales, how landscapes fundamentally affect the ways in which people live and also how landscapes are modified and managed.

The Loxton High School students did some great fieldwork along the River Murray whilst studying this unit. Head lead teacher Jo Simon talks about the trial in her Year 8 class last year. A great and informative trial for the development of the Australian Curriculum: Geography - well done to all involved.


Thanks to the generosity of the Loxton High School students and teachers in giving permission for their teaching materials and reflections to be part of this blog. In particular thanks to Jo Simon, the lead teacher for the trial at Loxton High School.

Inquiring, not telling!


Spatialworlds posting on inquiring to read
 
 * Inquiring about inquiry with the Australian Curriculum: Geography.


Back to the future with inquiry questions


It is more than telling!

Some questions for you: 

On the ‘teller’/inquiry spectrum I am …

To be successful Inquiry needs to be ...

What are the stages of Inquiry in the SACE Geographer courtse

What are the advantages for learning with the Inquiry approach?

What are some of the issues to keep in mind when planning an inquiry approach?

I think there is far too much emphasis on inquiry approaches in the classroom

Inquiry does not necessarily improve learning.

Why can it be said that Inquiry has the potential to be abused in the classroom.


Inquiry (in UK they talk about enquiry) is a word that is frequently thrown around when 21st Century curriculum is being developed.

The thinking is that students will be more connected to their learning and engaged to explore if they are stimulated to think via a range of inquiry questions on a topic/area of study:

"Tell me and I forget, show me and I remember, involve me and I understand." Joe Exline

Inquiry implies involvement that leads to understanding. Furthermore, involvement in learning implies possessing skills and attitudes that enable students to seek resolutions to questions and issues while constructing new knowledge. Useful application of inquiry learning involves several factors: a context for questions, a framework for questions, a focus for questions, and different levels of questions.

Inquiry Based Learning has fast become an accepted way for curriculum to be written, with student exploration, engagement and empowerment seen as positive outcomes.

However there needs to be a caveat to the use of Inquiry Based Learning in the curriculum. It is not a stand-alone approach but rather an approach which relies on an infrastructure of skills, thinking and foundation knowledge to ensure that the inquiry has rigour, veracity and sound conceptual understandings – it needs to be informed inquiry and not just ‘off-the top of the head emoting’ or ramblings based on minimal or uninformed, if not biased sources.

There is a potential for Inquiry Based Learning to be mis-used and abused by teachers without the skills, knowledge or understanding themselves on a particular geographical topic. To avoid such mis-use, the January 2011 Australian Curriculum shape paper for geography (page 21) attempted to develop a geography orientated inquiry process with rigour.

‘Geographical inquiry refers to the methodologies that geographers use to find new knowledge, or knowledge that is new to them, and the ways that they attempt to understand and explain what they have observed’

Naturally technology has a huge part to play in the development of a rigorous and valid inquiry methodology in the humanities. http://www.edutopia.org/lesson-planning-inquiry-modeling